| Webscraping Notebook | .csv File for Analysis | PCA & Cluster Analysis Notebook |
Abstract
We report a substantial difference in the length by word count and number of visual aids used in the online, open source Chem Libretext Bookshelves between chapters, demonstrating how challenging it can be for students to study from home or catch up on their classes using online tools for upper-level courses. Through webscraping and subsequent NLP analysis we illustrate a 3D cluster/topographical map of the strengths and weaknesses of course-critical materials for General Chemistry, Organic Chemistry, [Analytical Chemistry](https://chem.libretexts.org/Bookshelves/Analytical_Chemistry/Instrumental_Analysis_(LibreTexts), Physical & Theoretical Chemistry and Inorganic Chemistry by their chapter number from the Libretext bookshelves. Unfortunately, due to the lack of a Libretext or Opensource flagship bookshelf for Biochemistry and Environmental Chemistry, we were unable to suitably include them in our analyses. Further work should target these for inclusion, as well as better optimize the webscraping tool as runtimes can be challenging, depending on web service quality.
Fig 1). Topographical map of the webscraped word counts, figure counts and general difficulty of the course material (PCA of NLP complexity and the course’s mean ACS exam score).
Purpose
As a graduating senior in the Chemistry Department of Whitman College, I understand how challenging intoductory courses and their higher level counterparts can be for students who learn primarily from visual illustrations. I also know firsthand how challenging it can be to study or expand one’s comprehension in topics like Physical or Inorganic Chemistry without proper context as is given in classes, meetings or office hours. Its for this reason that I find online or open-source tools so meaningful, whereby the student can be better met at their level of understanding of the material, on their own schedule and on their own terms. Comprehension no longer has to happen between the hours of 8 A.M. and 5 P.M. During Inorganic specifically, I was met with a challenge I had not yet been presented with, a scheduling conflict directly hindered my ability to meet with my professor during office hours, leading me to frantically try to keep my head above water as I continually strugged to fine-tune my conceptions of vector transformations, bonding through symmetry and applied reaction chemistry through M.O. diagrams. It was then that I attempted to play catch-up with online tools and was helped immensely through Inorganic lectures published on Youtube, however the textbooks outside of the one assigned for my course were noticably lacking in depth and visualization. I hypothesize that the broader trends on Chem Libretext’s flagship bookshelves reflect my own anecdotal experience and further hope that the publication of this work might be noticed by minds far brighter than mine, such that the online tools for the wider understanding of the central science that I fell in love with may be better implemented or at least expanded upon.
Results and Analysis
To begin, we started with webscraping of simply the word and figure counts of our webpages’ body of text, aiming to disregard all other links or captions embedded in the pages’ HTML. Following this, we ran NLP (natural language processing) to better illustrate the complexity of the terminology while simultaneously sanity-checking our word counts (Table 1). Thanks to the University of Wisconsin @ Madisons publication of their ACS exam score statistics, we were able to find a suitable numeric model of the course’s “felt” complexity for the students, with which we ran PCA (principal component analysis) to linearize our models of course difficulty and better depict their variance (Fig 2). Now faced with a more robust definition of difficulty, our next challenge was in visualizing the discrepancies found in our initial research, beginning with a simple line plot of the chapter numbers and how that impacts the word count and our complexity matrix (Fig 3).
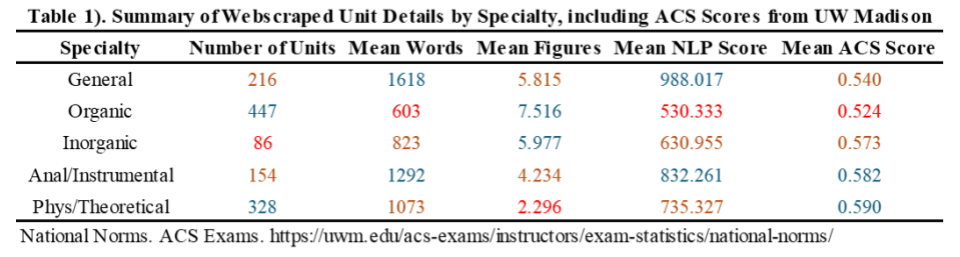
Table 1). Table of initially webscraped unit details for each specialty, their NLP complexity scores, mean and median ACS scores
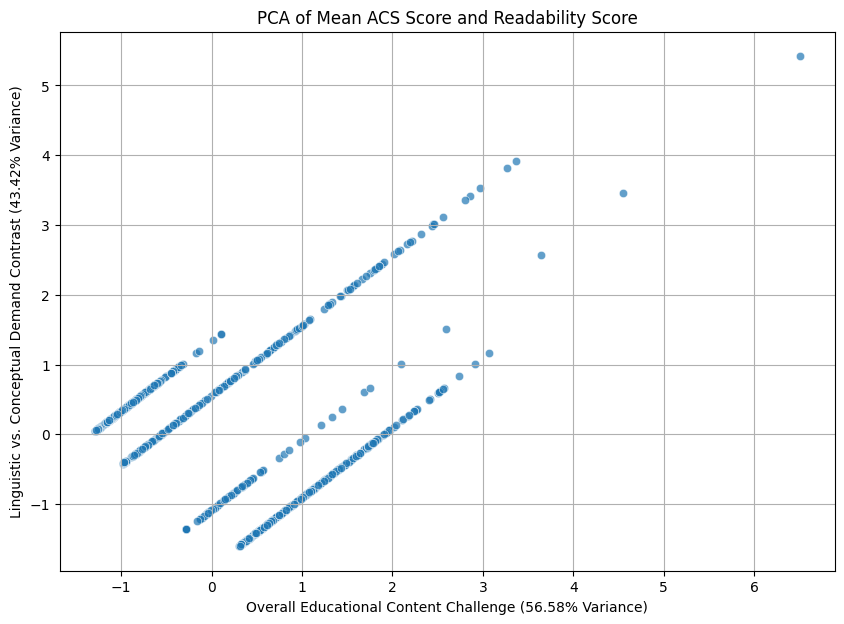
Fig 2). PCA of NLP and ACS scores in the assembly of our Net Difficulty Matrix
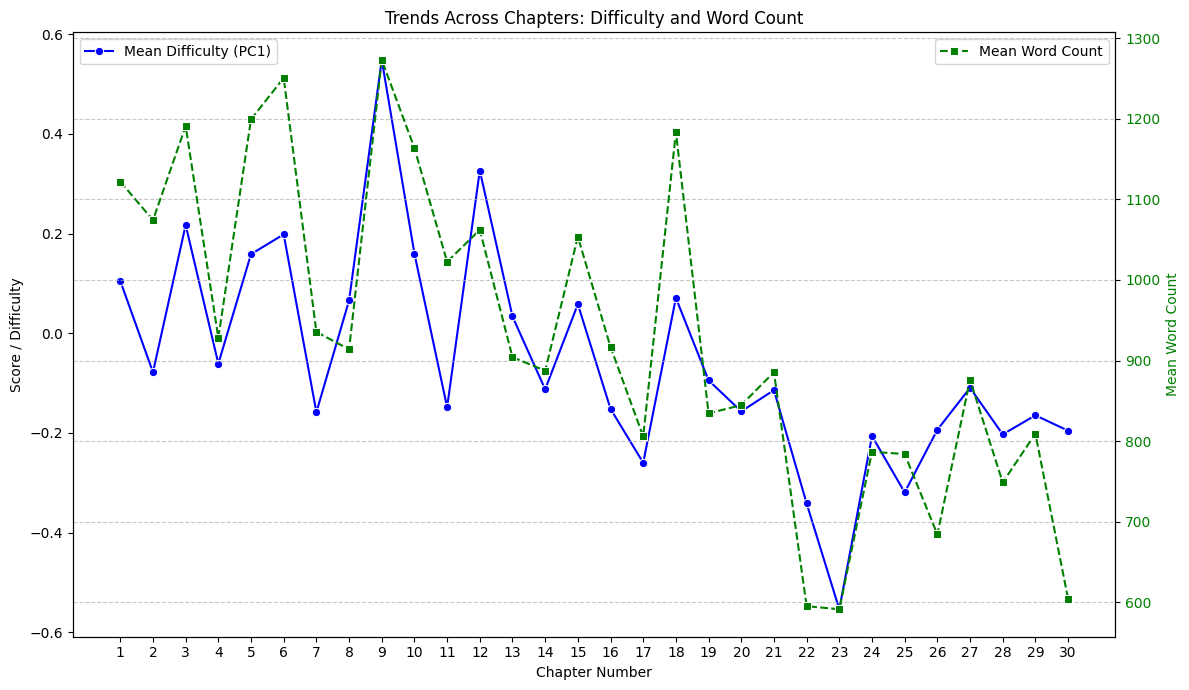
Fig 3). Line plot of chapter mean word counts and mean resultant difficulties v.s. chapter number, regardless of specialty
The overall downward trend, although populated with a number of relative maxima, certainly does reflect my experience in frantically searching for better answers to our innumerable questions throughout my tenure as an undergraduate chemist. Now, for our project deliverables, we elected to incorporate 3D visualizations for meaningfully “new” tools. For this specific use-case we believed at first that cluster analysis would be perfect or at least interesting, possibly helping determine differences in trends or differences between courses (Fig. 4).
Fig 4). Initial cluster optimization and subsequent analysis of chapter details, without the inclusion of the PCA
Fig 5). Initial cluster optimization and subsequent analysis of chapter details, with the inclusion of the PCA
The resulting graphics, however illustrated immense overlap and no immediately obvious trends, whereby the majority of trends are lost in the 1077 different units plotted among the map 4 lines from the mean ACS score/PCA analysis. We further struggled with visualizing the general unit details and course-difficulty to the chapter number, using PCA 1 (of NLP complexity and mean ACS score) and PCA 2 (their contrast) with the hue set to chapter number (Fig. 6).
Fig 6). Cluster analysis of chapter details and PCA, using chapter number as a differentiator
This helped a little bit more, guiding us in the right direction that there are some definite outliers within the first few chapters, whereby they recieved substantially more support in terms of written text and figures, however the overlapping bulk of the graphic is still largely obscured by the large number of data points. Upon further consideration, with the information gathered in our line plot (Fig. 2), we found that including NLP and word count subsequently was unnecessary, as complexity is built on the wordcount in the first place. Able to now disregard PCA 2, we sought to fit the word count and difficulty perpendicular to one another, using the arithemtic means for the chapter number in each direction to better reflect overall trends and minimize pollution and visual overpopulation (Fig. 7).
Fig 7). Topographical cluster map of word & figure counts, course difficulty and the chapter number, illustrating an overall downward trend in terms of course-critical support in higher chapters.
Conclusions
We confirmed the hypothesis that the online, opensource Chem Libretext textbook showed diminishing levels of written and visual support for higher chapter numbers in their textbooks, illustrating a further lack of attention furthering the education of students engaged in the upper levels of Chemistry. This work has demonstrated the ongoing inequity of opportunity, seemingly embedded in the fundamental sciences as a whole, as the exclusion of students who are unable to catch up or get ahead via online tools is immensely challenging to those willing to put in the work but cannot manage the time required to learn. Imagine a working student for a moment, who is then prevented from accessing higher levels of education or even asking fundamental questions because those answers are simply not written for them with easily accessible tools they can afford. If we’re going to make an accessibility tool for students or enthusiasts to learn from for free, we need to make sure that those tools are comprehensive and comprehensable. Science is so incredible in that its by everyone, in everyone and should be for everyone, regardless of their stake or interest.
Bibliography
1). Chemistry 2e (OpenStax). Chemistry LibreTexts. https://chem.libretexts.org/Bookshelves/General_Chemistry/Chemistry_2e_(OpenStax) (accessed 2026-05-09).
2). Organic Chemistry (OpenStax). Chemistry LibreTexts. https://chem.libretexts.org/Bookshelves/Organic_Chemistry/Organic_Chemistry_(OpenStax) (accessed 2026-05-09).
3). Inorganic Chemistry (LibreTexts). Chemistry LibreTexts. https://chem.libretexts.org/Bookshelves/Inorganic_Chemistry/Inorganic_Chemistry_(LibreTexts) (accessed 2026-05-09).
4). Instrumental Analysis (LibreTexts). Chemistry LibreTexts. https://chem.libretexts.org/Bookshelves/Analytical_Chemistry/Instrumental_Analysis_(LibreTexts) (accessed 2026-05-09).
5). Physical Chemistry (LibreText). Chemistry LibreTexts. https://chem.libretexts.org/Bookshelves/Physical_and_Theoretical_Chemistry_Textbook_Maps/Physical_Chemistry_(LibreTexts) (accessed 2026-05-09).
6). National Norms. ACS Exams. https://uwm.edu/acs-exams/instructors/exam-statistics/national-norms/ (accessed 2026-05-09).
7). Vdr, C. [NLP] Basics: Measuring The Linguistic Complexity of Text. TDS Archive. https://medium.com/data-science/linguistic-complexity-measures-for-text-nlp-e4bf664bd660 (accessed 2026-05-09).
8). NLP Collective. Stack Overflow. https://stackoverflow.com/collectives/nlp (accessed 2026-05-09).
9). What Is Principal Component Analysis (PCA)? IBM. https://www.ibm.com/think/topics/principal-component-analysis (accessed 2026-05-09).
10). Principal Component Analysis with Python. GeeksforGeeks. https://www.geeksforgeeks.org/data-analysis/principal-component-analysis-with-python/ (accessed 2026-05-09).
11). doug. Answer to “Principal Component Analysis (PCA) in Python.” Stack Overflow. https://stackoverflow.com/a/13224592 (accessed 2026-05-09).